In nature, we witness the blossoming of flowers in spring and the ripe harvesting of crops at summer's end. Analogously, gold exhibits its own rhythm with distinct seasonal patterns and trends that reverberate through its market performance. This article will delve deeper into the nuances of gold's seasonality, understanding its cyclicality, and the profound implications these patterns can have for investors.
The Rhythm of Gold Investments
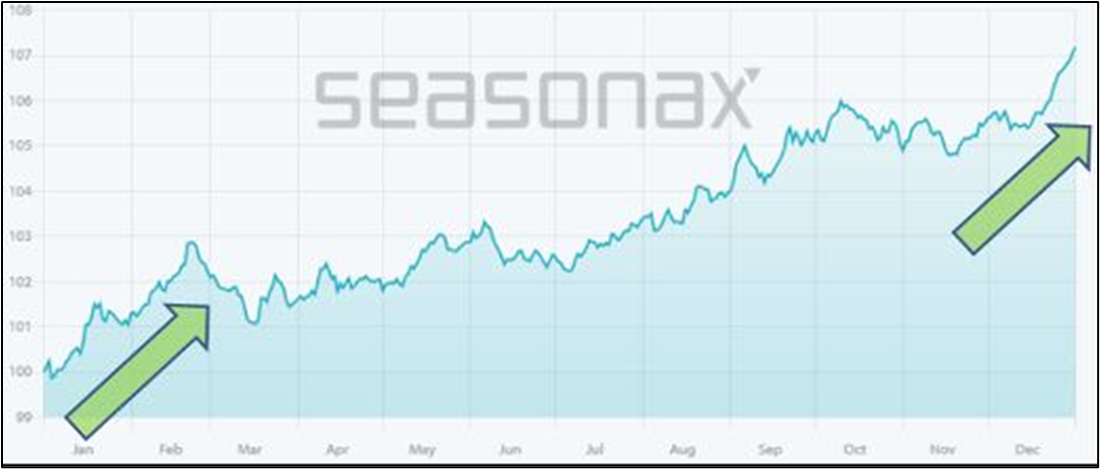
Seasonax, through a comprehensive study spanning 54 years, has highlighted that gold experiences a particularly robust period starting from mid-December, stretching until the latter part of February. This seasonally intensified phase is worth noting for those looking to make strategic investments.
Optimistic Phases in Gold's Seasonal Cycle
Analyzing the extensive dataset, one can observe that gold often hits its seasonal low between 15th and 20th December. By the end of February, it often reaches a median seasonal high. While there have been years where gold prices remained stagnant, an overarching trend emerges: in the past two decades, gold's prices rose during this two and a half month window in 14 out of 20 years. This translates to a significant 70% chance of gold experiencing a price surge during this phase.
Moreover, this bullish period for gold has seen average gains oscillating between a promising 8.5% to a robust 18%. In contrast, losses during these periods were comparatively muted, ranging between –1.6% to –3.3%. Such patterns have led to gold being a profitable venture annually since 2013.
The Cultural Backbone
Gold's Rising Demand Cultural paradigms, especially in countries like India, significantly influence gold's demand. Deep-rooted in Indian traditions is the inclusion of gold and gold jewellery in dowries. With approximately 10 million weddings taking place annually in India, the period from October to March (coinciding with favorable temperatures and weekend religious festivals) witnesses a staggering surge in gold demand.
Lending credence to this observation, Kar Yong Ang refers to the World Gold Council's 'Gold Demand Trends Q2 2023'. He points out, "In 2022, India emerged as the world's predominant consumer of gold, procuring a mammoth 601 tonnes. This accounts for a substantial 28% of the global jewellery consumption, with China tailing closely at 598 tonnes."
China, with its growing middle class and cultural affinity towards gold, echoes a similar demand pattern. The Investor's Play: Post U.S. FOMC Meetings Gold's performance and investor sentiment post the U.S. Federal Open Market Committee (FOMC) meetings in December is another pivotal factor. Data from the Commitments of Traders (COT) reveals a marked pessimism towards gold before these meetings—with a significant 87% of futures traders adopting neutral or bearish stances. However, it's worth noting that gold's seasonal interim low aligns with the FOMC's last annual meeting.
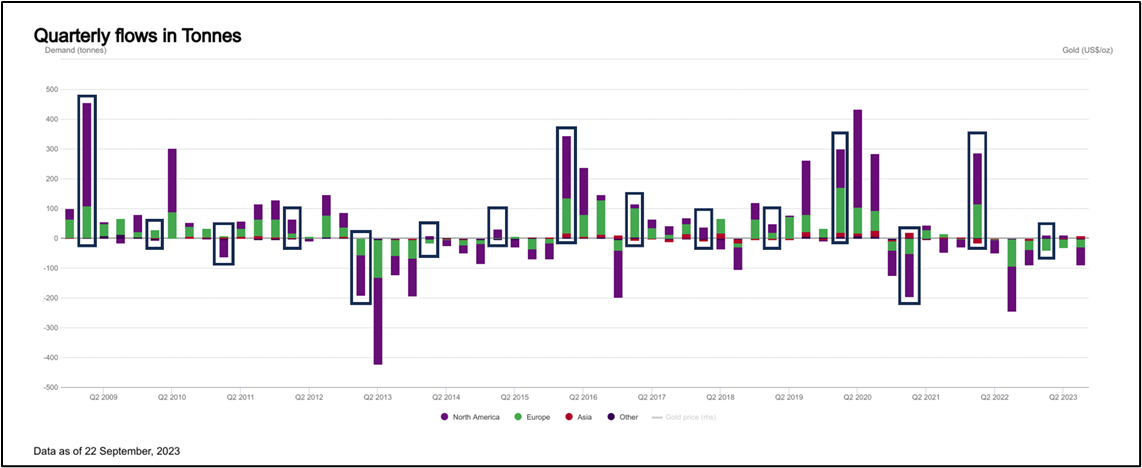
This trend is further buttressed by Gold ETF flows, showing an intricate correlation with the aforementioned patterns. Data from the World Gold Council adds another dimension: in the past 15 years, there were 11 instances when fund positions burgeoned in the first quarter. This implies that gold purchases were predominantly made in January, February, and March.