Get ready for another instalment in our technical analysis educational series. After a multi-week hiatus, we’re back and ready to share even more knowledge and practical skills on this highly useful, frequently underestimated trading tool. Both short-term traders and long-term investors can potentially benefit greatly from using technical analysis properly. Doing so can help market participants pick optimal entry and exit points, which makes technical analysis a useful string to anyone’s bow.
After covering the Average True Range in our last piece, this week, we decided to shed light on a little-known indicator known as the Directional Movement Index (DMI).
What is the DMI?
The directional movement index, or DMI for short, is a trend indicator developed by legendary market analyst J. Welles Wilder in 1978. It works by identifying the direction in which the price of an asset is moving. It does this by comparing prior highs and lows and drawing two lines: a positive directional movement line (+DI) and a negative directional movement line (-DI). There is also an optional third line called the average directional index (ADX), which can also be used to gauge the intensity of the uptrend or downtrend. Basically, when +DI is above -DI, it means upward price pressure is greater than downward pressure.
On the other hand, when -DI is above +DI, this means the greater pressure on the price is downward. In the Libertex app, it’s possible to calculate and overlay the DMI directly onto any chart, sparing us significant mathematical gymnastics.
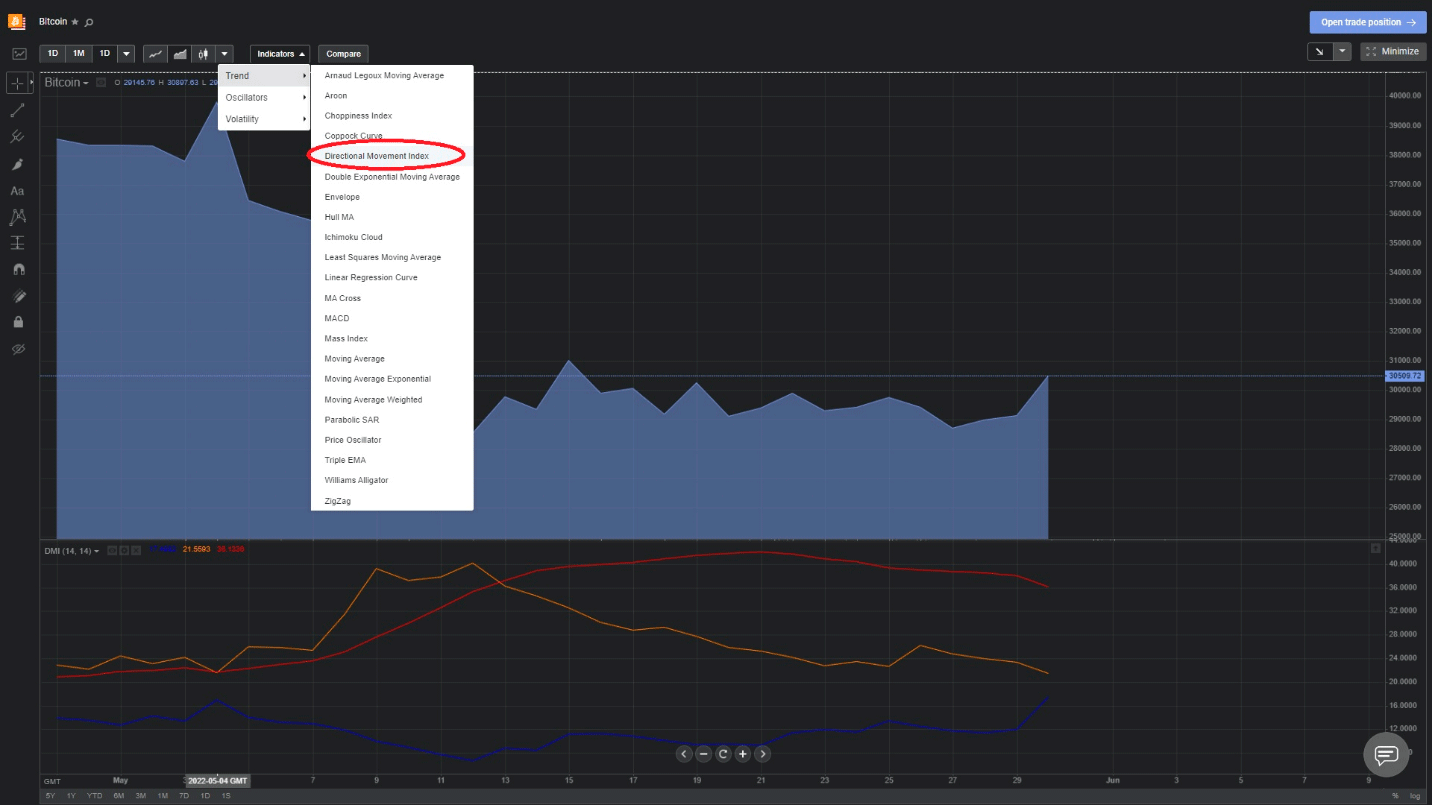
Given DMI’s use when it comes to establishing the direction and strength of trends, long-suffering Bitcoin could be an interesting instrument to apply it to on the monthly chart. Of course, you can use it with any instrument and timeframe you like, but let’s try this one. All you need to do is go to your Libertex account, enter full-screen mode on the chart timeframe of your choice, place your cursor over the indicators tab, select ‘Trend’ and then click "Directional Movement Index" as shown below:
Why use DMI?
Whilst not the most famous indicator we’ve looked at, DMI is an excellent method for reliably assessing both the direction and strength of a given trend. When used in conjunction with some of the other TA tools we’ve reviewed (notably the ATR and RSI), it becomes an even more powerful predictive tool.
Crossovers are the main trading signal generator with the DMI. For instance, when the +DI crosses above the -DI, it indicates an uptrend. Conversely, a sell signal is generated when the +DI instead crosses below the -DI. Like any technical analysis method, it is far from flawless and should typically be combined with other complementary indicators, as mentioned above.
Practical applications
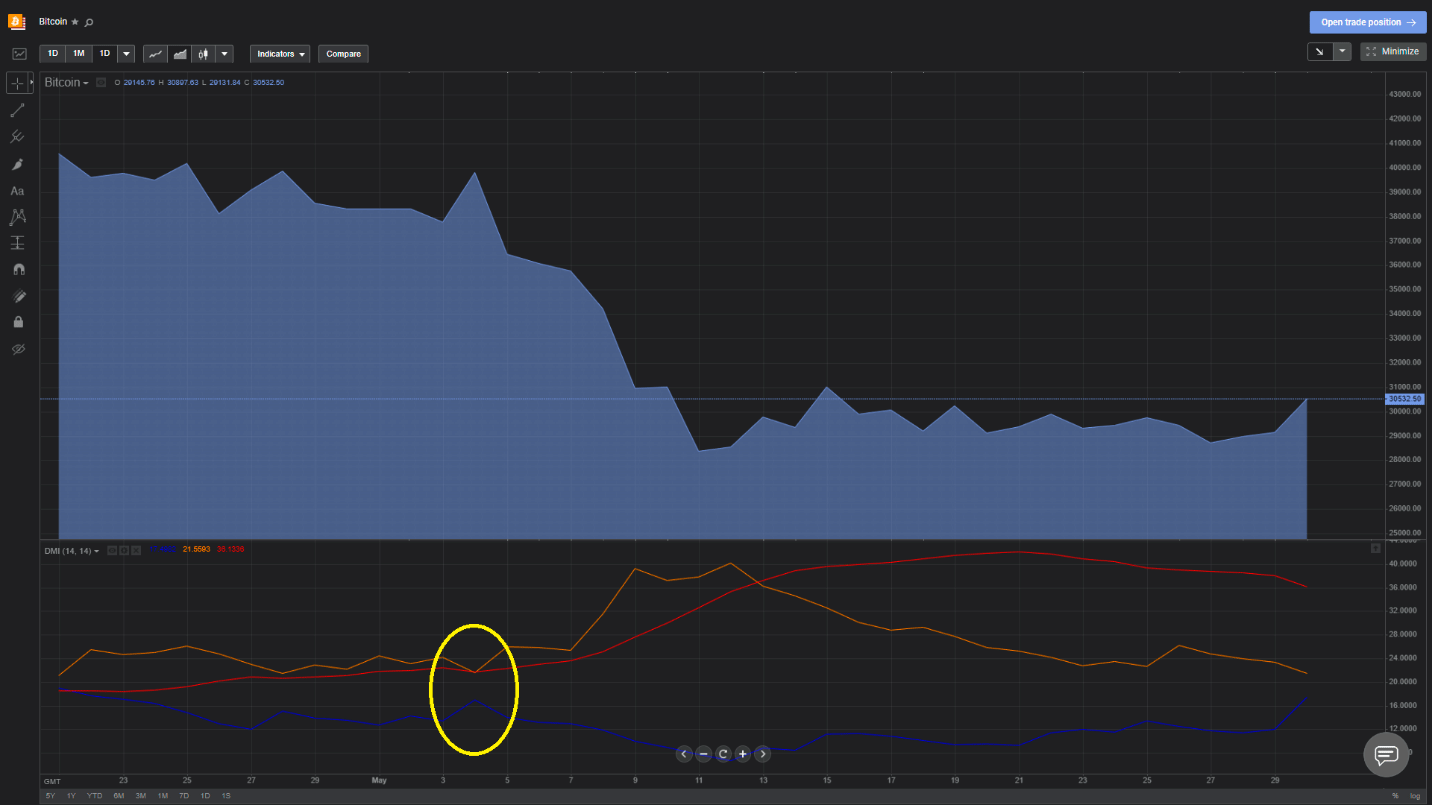
The most practical use of the indicator is as a trade confirmation tool. Essentially, if the -DI is well above +DI, the trend has serious strength on the downside. Naturally, this will provide a solid confirmation for a short position. Let’s look at that same monthly BTC chart with the DMI overlaid and see if we can spot the signal:
Naturally, this isn’t a fool-proof method, but in day-trading – not much is. As the ATR doesn’t tell us which direction the breakout will occur, we need a trend confirmation (i.e. whether the given stock is overbought or oversold) in order to pick a direction for the trade. Let’s look at that same Google chart now with both the ATR and RSI overlaid:
Look closely at the point at which the two lines intersect (circled in yellow). After this, the -DI (orange) clearly pulls away from the +DI, leading to the initiation of a powerful downtrend that has lasted until the end of the current month (May). While on this occasion, the signal was both correct and leading, there are many false signals generated by the DMI, and it’s wise to seek confirmation through the use of another trend indicator, such as the RSI.
With that in mind, let’s add the RSI to this same chart and see if we get a confirmation:
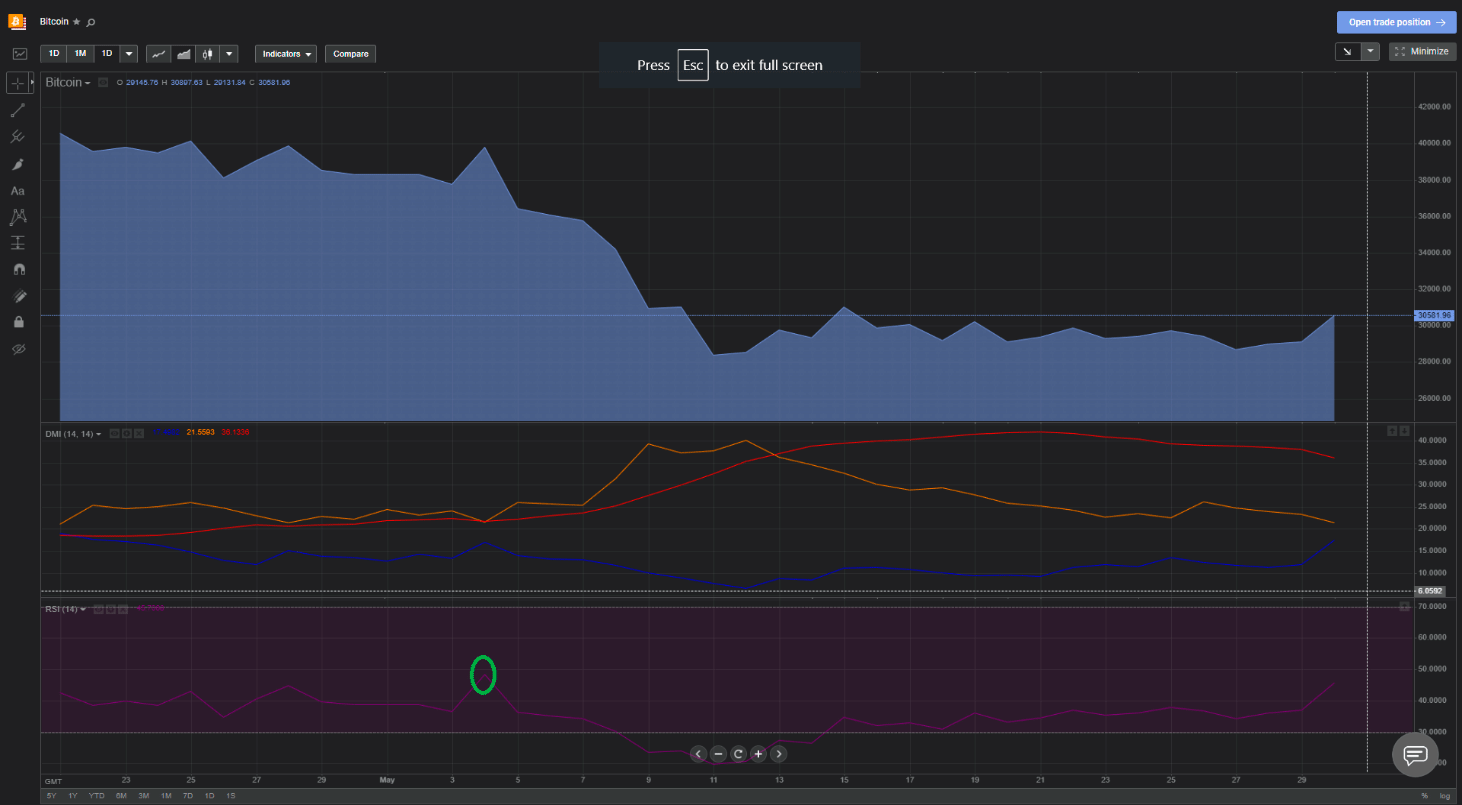
Notice the spike in the RSI just at the exact same point that the DMI crosses over? This indicates a sharp increase in buying just at the moment that the downtrend begins to form. Taken together, you could feel relatively confident opening a short position on the basis of these indicators. Of course, it’s always wise to seek further confirmation as nothing is certain in trading, and the more data you have on your side, the better.
With the crypto market under pressure at the moment, Bitcoin would actually be quite an example to track to see whether a dominant downtrend is taking hold or a correction to the upside is at hand. And thanks to Libertex, you can now trade Bitcoin CFDs as well as dozens of other cryptocurrency CFDs.