Support and Resistance is not just a mere technique but the very backbone of technical analysis. Its simplicity in theory is juxtaposed with its complexity in practice, making it both alluring and challenging for traders. It serves as the foundation, indicating where the price has historically shown significant reactions. By understanding the patterns and the psychology behind these levels, traders can predict future price movements with greater accuracy.
Origins and Significance
The phenomenon of Support and Resistance is rooted in the collective psychology of market participants. It emanates from the consistent patterns of buying and selling at specific price points. When many traders react to these historical points, they collectively reinforce these levels' significance.
- Support Level: This is the fortress where buyers, driven by optimism, tend to shield the asset from falling further.
- Resistance Level: Conversely, this is the ceiling where sellers, influenced by pessimism or profit-taking, put a halt to rising prices.
The Nuances of Prediction
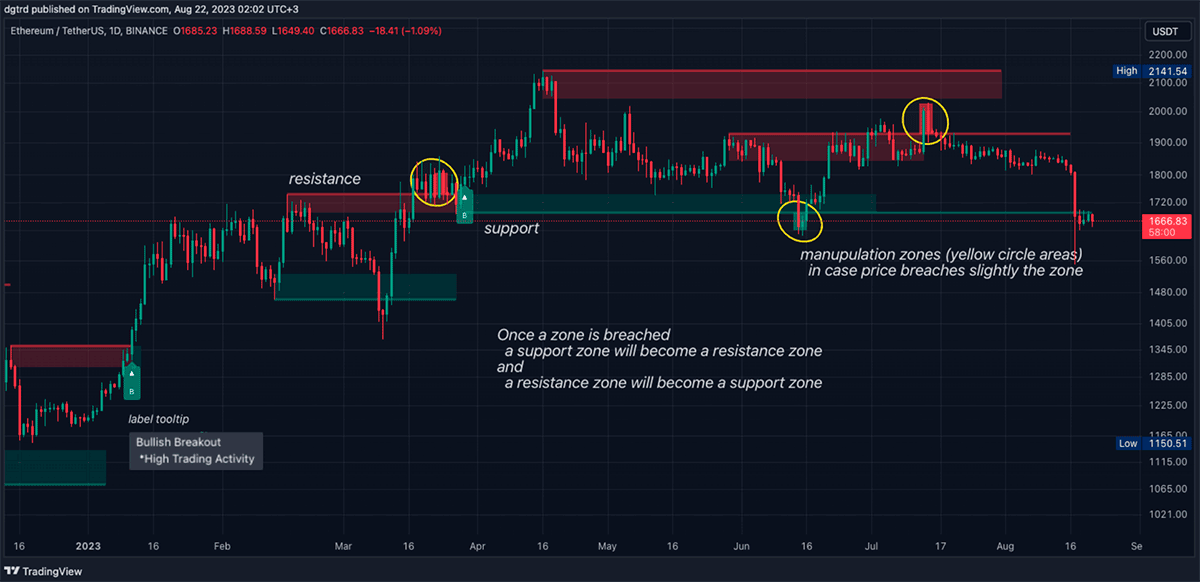
In the intricate dance of prices, there are no guarantees. While support and resistance levels are influential, they aren't impenetrable. The interplay of various factors means prices might occasionally breach these levels, hence traders should always factor in probabilities rather than certainties.
The Art of Delineation: Understanding Zones
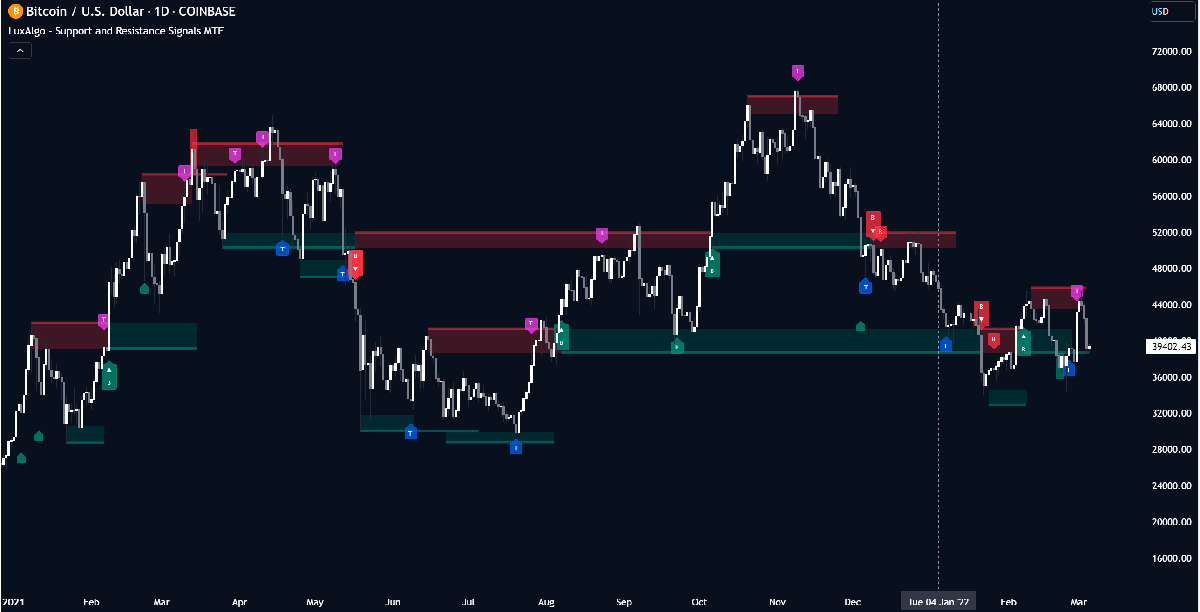
Support and Resistance don't manifest as laser-precise levels. They are better visualized as zones, reflecting the natural ebb and flow of price dynamics. For instance, a pair like EUR/USD might not reverse precisely at 1.1500 but might hover around it, creating a zone.
Factors influencing the breadth of these zones include:
- Asset Characteristics: Different assets have inherent volatilities which shape their zones.
- Time Frames: For instance, daily charts will have broader zones compared to hourly charts due to the aggregated data.
- Market Volatility: External triggers, like economic news, can dramatically affect volatility, thereby altering zones.
Spotting the Key Levels and Zones
Several tools and techniques can help traders demystify these crucial points:
- Historical Patterns: Levels that have been tested multiple times without being breached gain credibility.
- Psychological Levels: Human psychology often attributes significance to round numbers, making them potential resistance or support zones.
- Technical Indicators: Tools like Moving Averages, Fibonacci Retracement, Pivot Points, and Bollinger Bands provide insights into potential levels.
Gauging the Robustness: Differentiating Between Strong and Weak Levels
Not all levels are created equal. The strength of a level is determined by its historical significance, the volume of trades, and its alignment with other market indicators. Strong levels act as formidable barriers, while weak levels might offer only temporary resistance or support.
Strategic Integration for Success
Support and Resistance, when understood and applied judiciously, can be the cornerstone of various trading strategies:
- Buy Low, Sell High: Capitalize on buying at strong support levels and selling at formidable resistance points.
- Breakout/Breakdown Trading: Position trades based on price movements breaking through established levels.
- Bounce Trading: Trade based on price retracements from established levels.
- False Breakout Strategy: Profit from price movements that trick traders into thinking there's a breakout, only to revert to the original range.
Conclusion: Balancing Knowledge and Prudence
Support and Resistance levels are vital navigational tools in the trading journey. However, it's paramount for traders to remember that they are instruments, not certainties. By coupling this knowledge with other analytical tools and maintaining a disciplined approach to risk management, traders can charter their course in the unpredictable waters of financial markets with increased finesse and assurance.