As we all know, the price movement of any asset is determined by supply and demand. Demand and supply for an asset depend on many factors, which can be divided into three broad categories - fundamental, technical, and psychological. In most cases, fundamental factors are primary in relation to other factors. Thus, it would be logical to determine which stocks would be classified as breakout stocks based on these factors.
Identifying stock breakout patterns with fundamental analysis
Fundamental analysis can be quite difficult to interpret, but it is often the most correct analysis for determining stock breakout patterns. When analyzing stocks, it is imperative to pay attention to the following fundamental factors:
- Beta
- Dividends/buybacks
- Market sector
The first way to identify breakout stocks using fundamental analysis is to understand which phase of the economic cycle we are in and to buy/sell those stocks which will move ahead of that cycle. There can only be two cycles: economic growth or recession. In a growth cycle, GDP rises and unemployment falls.
Key rates in a growth cycle are low enough to allow stock markets to rise. Breakout stocks in this case will be those that grow faster and break through their resistance levels. In a recession, the opposite is true - GDP declines, unemployment usually rises and the central bank rushes to raise its key rate, which leads to lower stock markets.
Breakout stocks, in this case, are those stocks that will fall the hardest, i.e. consistently break down their support levels. In order to find such stocks, we need to pay attention to the beta-ratio and select those stocks whose beta will be maximal. These are the stocks that will move ahead of them. Let's take Meta (Facebook), Amazon, Apple, Netflix and Google (FAANG) as examples.
2022 is a down year for the economy. Inflation is rising, key rates are rising and stock markets are falling. In this case, it would be reasonable to open Down trades in stocks with the highest beta.
| Company | Beta (5y Monthly) | Growth during the last 6 month |
|---|---|---|
| Meta | 1.40 | -41.50% |
| Apple | 1.19 | -10.20% |
| Amazon | 1.25 | -16.30% |
| Netflix | 1.28 | -47% |
| 1.10 | -12.60 |
As can be seen, the stocks with the highest beta are the ones that are falling the most. This means that a breakout of support levels in these stocks is more than likely. You can find information on beta stocks simply by searching 'Meta stocks beta' on Google.
Dividends and buybacks
All stocks can be roughly divided into two broad categories:
Growth stocks and value stocks
Before dividends are paid, a so-called record date. The closer to the record date, the bigger the demand for the stock may be, as more investors will buy it to get their dividends. After the record date, however, the opposite may be true - an increase in supply. Because anyone who wanted to get dividends after the cut-off may rush to get rid of the stock. A surge in supply or demand could result in a breakdown of significant support or resistance levels.
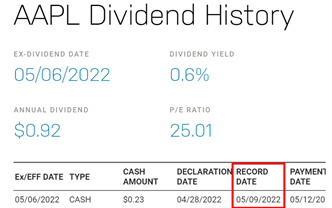
Apple Dividend history
Let's understand how this works using Apple stock as an example. The Nasdaq website provides information on the last record date, which is 05/09. In order to receive the dividend, investors had to buy the stock two working days before this date, i.e., no later than 05/06 (05/07 and 05/08 were weekend days).
Thus, on the 6th of May there could have been a spike in activity in Apple shares in the market, after which demand should have fallen, which could have led to a breakdown of the level. Let's take a look at the 15-minute chart below
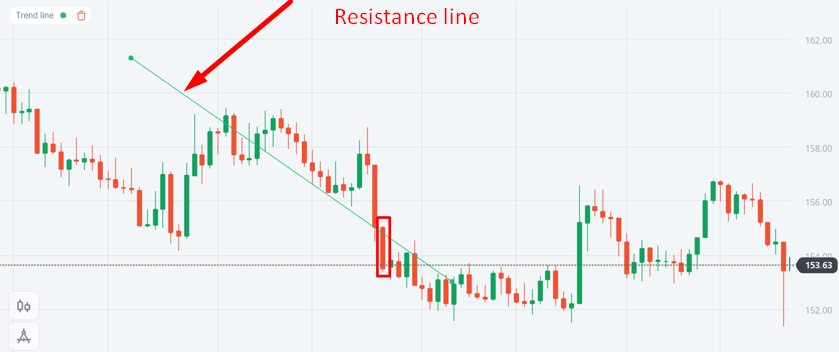
Apple stocks. 15 minutes TF
As can be seen on the 9th of May, the share price began to fall precipitously, breaking through its support level. All investors who wanted a dividend bought up Apple shares before the 6th of May and a selloff followed. Incidentally, of the FAANG sector stocks, only Apple pays dividends. The other companies reinvest their profits in business development. Therefore, there is no cut-off date for them and hence no breakdown of levels on dividends.
Meanwhile, some companies, instead of paying dividends, are buying their own shares off the market and raising the price for investors. It is wise to look for breakout stocks among companies that make regular share buybacks. It is possible to find buyback information in a special calendar on any publicly accessible website.
Market sector and news background
In any economic cycle (recession or recovery), stocks will always perform better or worse than the market. In the market, it is possible for individual market sectors to be rising during an overall downturn and it is easy to find breakout stocks among them. A prime example is 2020 and the COVID-19 pandemic recession. Among the breakout stocks in this case, are “Healthcare” sector stocks.
Let's look at Pfizer shares traded on the NYSE and compare them to the Dow Jones Index (red line)
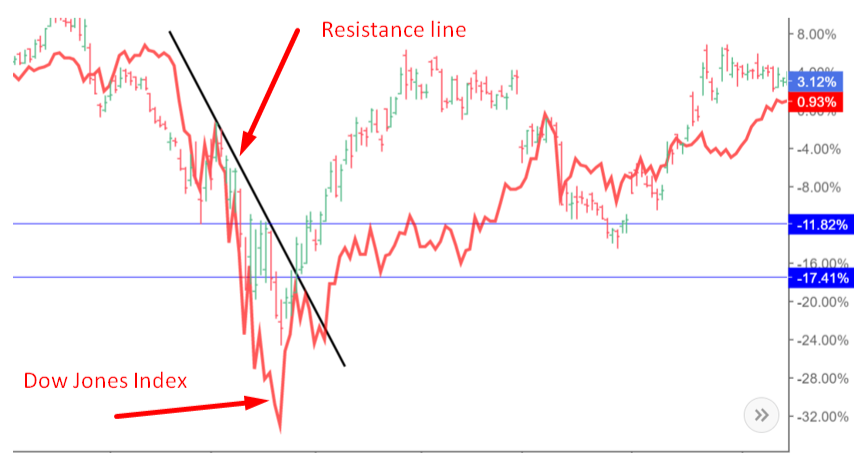
Pfizer stocks. Dow Jones Index. 1D TF
It can be seen that in March 2020 the share price correlated quite strongly with the index, however, in April-May 2020 the index went into a flat. At the same time, the share price broke through its resistance level and started rising, i.e. Pfizer stock turned into a breakout stock. The reason was market participants' optimism about a COVID vaccine.
In order to understand which stocks will become breakout stocks during different economic cycles, one must have a little understanding of the economy and the causes that lead to an economic downturn or upturn.
By the way, a downturn or upturn in an economy can be not only global, but also local in its individual sectors. Shares of individual companies rise and fall depending on the beginning of a particular economic cycle for those companies. However, we are not going to dive too deep into this issue.
The definition of stock breakout patterns can be considered a whole science that includes many sections. However, we provide you with a trader's main weapon - useful information. In this part, we will delve into the tools for early detection of breakout stocks. Breakout trading can be implemented in almost all trading styles, which means it is available to all traders. Read on to learn the important nuances and about the anatomy of this style of trading and investing.
Applying technical analysis to determine breakout stocks
In order to identify stock breakout patterns, classic technical analysis techniques can be used. First and foremost, these are chart and candlestick patterns. Also widely used are methods of analysis of trading volume and indicators, based on volume. It may seem like gambling to find breakout stocks, but it is an investment with the goal of making real money. Let's take a look at how it works.
Classic technical analysis patterns
One of the classic reversal patterns of technical analysis can be formed before breakout stocks appear. For example, double/triple tops/bottoms or head and shoulders. It is also possible to identify such stocks using candlestick analysis or price action methods. Let's look at Pfizer stock, which declined strongly in 2020 and then also rose noticeably, becoming a breakout stock.
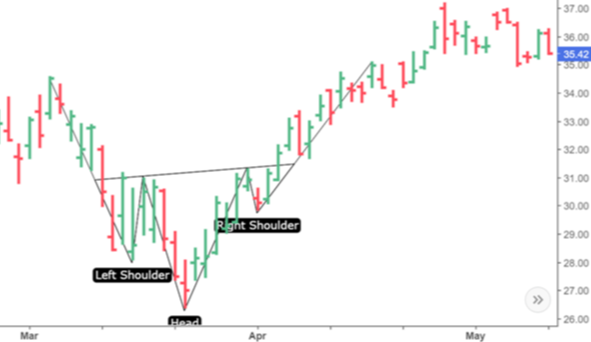
Pfizer stocks. 1D TF. Head and shoulders pattern
We can see that before the stock made a breakout upside, the price formed a classic bullish inverted head and shoulders pattern with its highest highs/lowest lows around $28.11, $26.43, and $31.28. Thus, the neckline was formed by two highs from 3/17 and from 3/31.
The emergence of a reversal pattern significantly increases the chances for the stock to move into breakout territory. The same applies to candlestick/price action patterns.
Volume analysis
Breakout stocks can be identified fairly confidently using a volume indicator.
It is sufficient that at least one of two conditions is true:
- When the price reverses, there is a volume spike. It is essentially the same as a reversal pattern.
- When a significant support/resistance level is broken, the volume increases significantly.
The volume of Pfizer stock increased significantly when the lowest low ($26.43) was formed on 3/23. At the same time, there was no surge of volume at the breakdown of the resistance level.
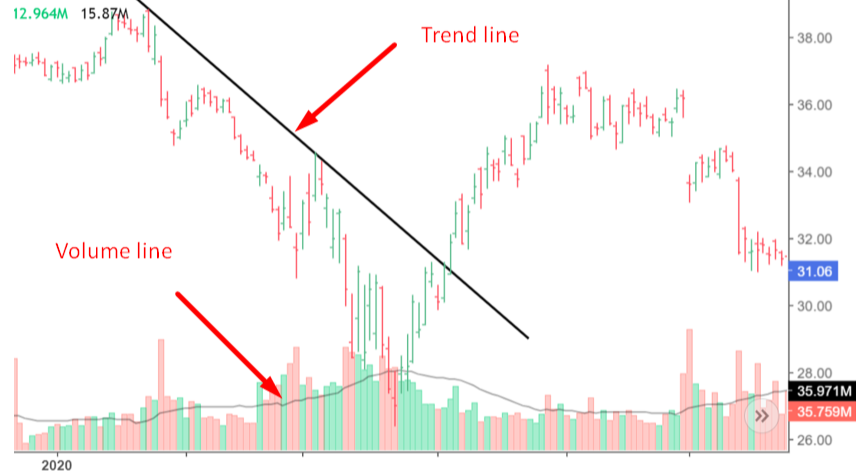
Pfizer stocks 1D TF
Actually, we're being a bit sly here, as the spike in volume was seen across the stock market as a whole.
However, comparing this spike in Pfizer with other factors such as:
- The formation of the classic head and shoulders pattern.
- Pfizer's sector, which was "stronger" than the market.
One could conclude that the stock would turn into a breakout stock, i.e. it would break through its significant resistance level.
Bonus time: Market anomalies
There are many anomalies in the stock market that can be used to identify breakout stocks. Here are some of them:
- The P/E effect. A stock with a low P/E can show a higher expected return. In other words, if you choose a stock with a lower P/E, the chances that your portfolio will include breakout stocks are significantly increased.
- Small-firm effect. It has been observed that small capitalisation stocks increase the most in January of each year. It means that when choosing stocks to include in a portfolio at the end of the year, one should pay attention to shares of small companies. The chance to find breakout stocks among them increases significantly in January.
- The Neglected-firm effect. The tendency to invest in neglected firms. This is more of a psychological effect. Breakout stocks can be looked for amongst the low-listed firms. Under certain market conditions, it is these firms that can be amongst the leaders of the breakout levels.
- Reversal effect. The tendency of low-yielding and high-yielding stocks to periodically reverse their positions. This means that companies whose stocks perform worse than the market may show higher returns in the next period and vice versa. Thus, stock breakout patterns can be searched using this criterion as well.
Conclusions
We talked about all the nuances and technical details for finding stock breakout patterns.
Let's summarize and highlight the main concepts
- Technical and fundamental analysis methods may be used to find Breakout stocks.
- It is worth looking for breakout stocks among the stocks with the highest beta ratio.
- Stocks may move into the breakout category when the record date for dividends arrives. Traders will rush to buy such stocks before the record date, which can lead to a breakout of significant resistance levels. After the record date, they will try to get rid of them, which can lead to a breakout of significant support levels.
- When selecting breakout stocks, it is worth paying attention to the company's sector. Some sectors may appear better or worse than the market as a whole. In order to understand which sector will be among the losers or winners, one should try to understand the causes of economic decline or rise.
- Unexpected news can lead to breakout stocks. Unfortunately, it is a black swan and it is almost impossible to determine the exact moment when the news will appear.
- If a stock makes a classic bullish or bearish pattern, it is more likely to break support/resistance. It is worth looking out for such stocks.
- The trading volume of breakout stocks goes up when they break a significant support/resistance level. In general, any spike in volume is an anomaly worth looking out for.
- Several classic market anomalies can help identify breakout stocks. Such anomalies include the P/E effect, Small-firm effect, Neglected-firm effect, and Reversal effect.
In the hands of a knowledgeable trader or investor, breakout stocks are a great way to make money. If you have read both parts of our detailed material, you are familiar and ready to trade breakout stocks. Refine your data on a demo account and enter the world of real investment and trading with Olymp Trade!