A key aspect of successful trading is an effective trading strategy. Even novice traders know this. However, the development of a successful system of earnings in financial markets is not an easy task. Only traders with real trading experience and deep knowledge in the field of technical and fundamental analysis can do this. Beginning traders mainly pay attention to ready-made strategies, descriptions of which can be found on each Forex thematic resource. Similar trading systems are in the hundreds. The problem is that most of them are ineffective in practice. This article will review in details the truly effective strategy. This method will allow you to start earning almost from the first day. The peculiarity of this strategy is that it can be used both for intraday trading and for placing longer-term orders.
Commodity Channel Index based strategy with up to 50% profit potential per month
At the heart of the trading strategy there is the CCI indicator (Commodity Channel Index) a fairly effective oscillator, undeservedly forgotten by most traders. The algorithm for calculating trading signals differs significantly from other oscillators. It is noteworthy that CCI can be applied in practice not only as a comprehensive analytical tool. In fact, the correct settings of the indicator will allow you to convert it into a full-fledged, independent trading strategy, which even beginners will cope with. Before proceeding to the system description and trading rules, it is recommended to pay attention to the CCI oscillator itself and the algorithm for calculating overbought / oversold zones.
What is the Commodity Channel Index?
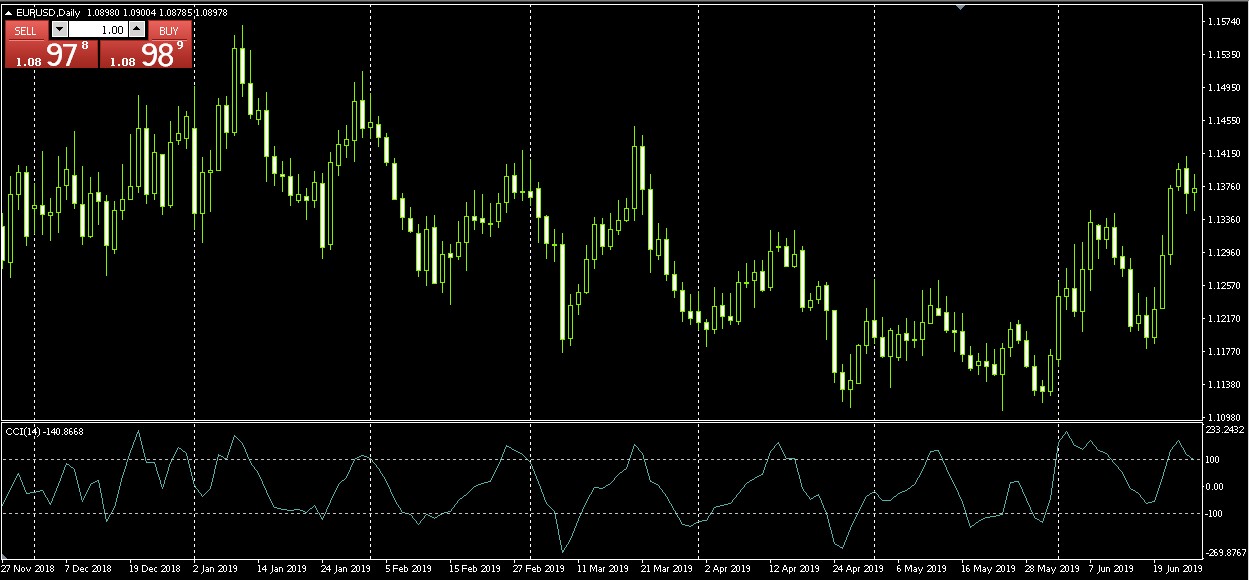
CCI is a custom oscillator that is included in the set of standard analytical tools of many trading platforms, including MetaTrader, JForex and others. The indicator is a classic curved line, which is built in an additional window under the price chart. In addition to the CCI line itself, the developer provides 2 levels with standard values of 100 (overbought zone) and -100 (oversold zone). On the CCI chart it is displayed like this:
It was previously mentioned that the algorithm of this tool is significantly different from other oscillators applicable to identify overbought / oversold zones. It is worth saying that CCI was originally designed to work with charts that display the pricing of commodity assets. The formation of the value of commodities differs from other financial instruments in cycles. For example, oil prices almost always rise in the cold periods of the year, and fall in the warm. When trading commodities, CCI is used to identify the best point to open a trading order.
In simple terms, the commodity channel index determines the value of the current value of the asset relative to the average for the time period specified in the settings. The standard input parameters provide a period of 14 (with a timeframe H1 - 14 hours, D1 - 14 days, and so on). If the indicator line is above the overbought level, then this indicates an overestimated price of the asset in relation to the average. Low values ​​of the indicator indicate an underestimated price of the instrument chosen for trading, which indicates an imminent increase in value. Such an operation algorithm allows the indicator to generate sufficiently accurate signals for trading.
Why is the CCI indicator now practically not used if its signals are pretty accurate? The fact is that this oscillator was developed for the commodity market, which differs significantly from over-the-counter pricing features. In the Forex market, assets’ volatility is much higher. In addition, significantly more factors affect the formation of the value of the national currency. Therefore, using CCI with standard input parameters when trading currency pairs is inefficient, but this can be corrected by specifying the correct settings when the indicator starts.
Oscillator CCI: the right settings for Forex trading
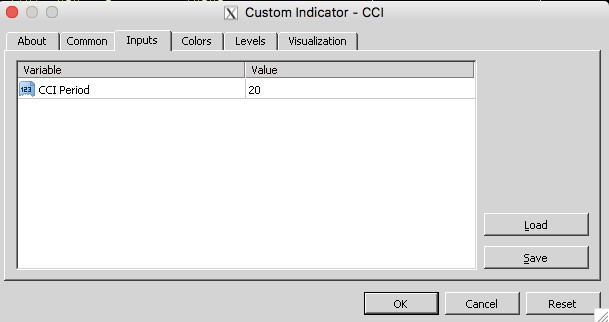
One of the distinguishing features of the OTC market, in comparison with the commodity and stock markets, is the predominance of market noise, especially when it comes to working with low time frames. Therefore, for the correct operation of the CCI indicator, you will need to increase the period provided by the developer. In the course of testing the features of the oscillator, it was possible to come to the unequivocal conclusion that for working with currency pairs on H1 charts, the optimal period is 20:
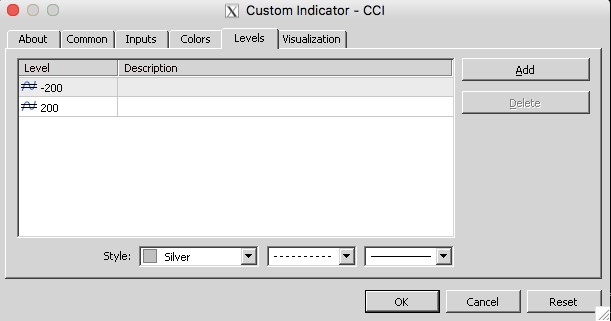
The values of overbought / oversold levels are also difficult to call correct due to the high volatility inherent in the foreign exchange market. In the Levels menu, it is recommended to set the values to 200 and -200, respectively:
For a more comfortable visual perception, it is also recommended to slightly increase the width of the oscillator curve in the Colors menu, but this depends on personal preferences and does not affect the correct operation of the indicator.
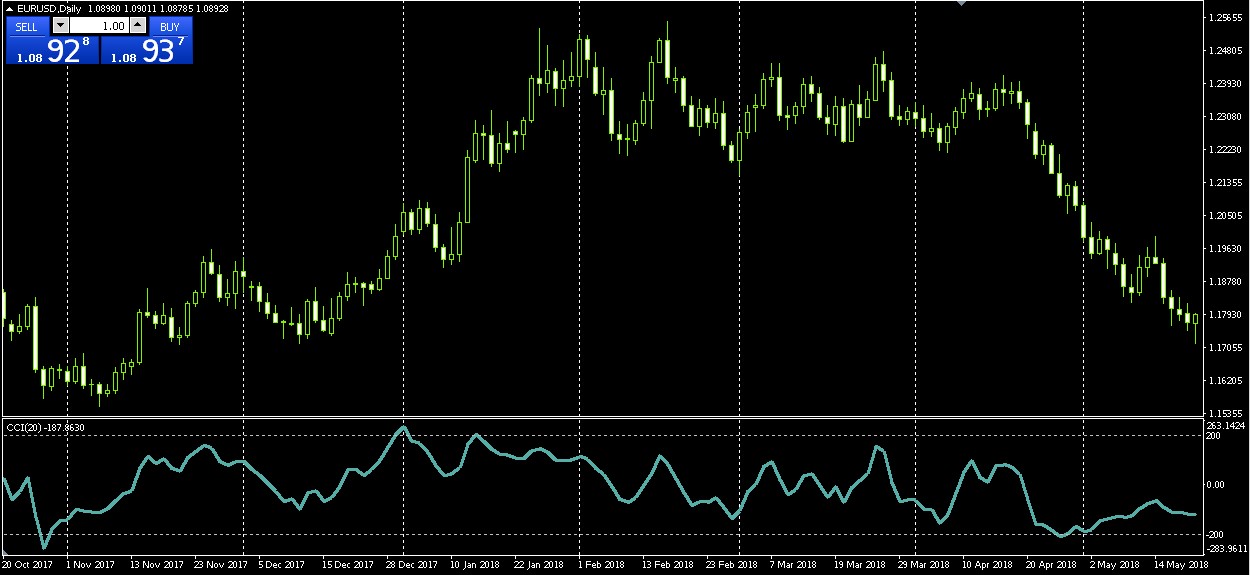
After entering the correct CCI input parameters, click OK. A correctly configured oscillator will be displayed in the terminal window as follows:
Attention! The CCI line crossing one of the levels does not limit the functionality of this tool. Since CCI is an oscillator, it can be used to identify divergence in order to confirm the correctness of the trading forecast. To do this, you will need to additionally set the zero level in the indicator window:
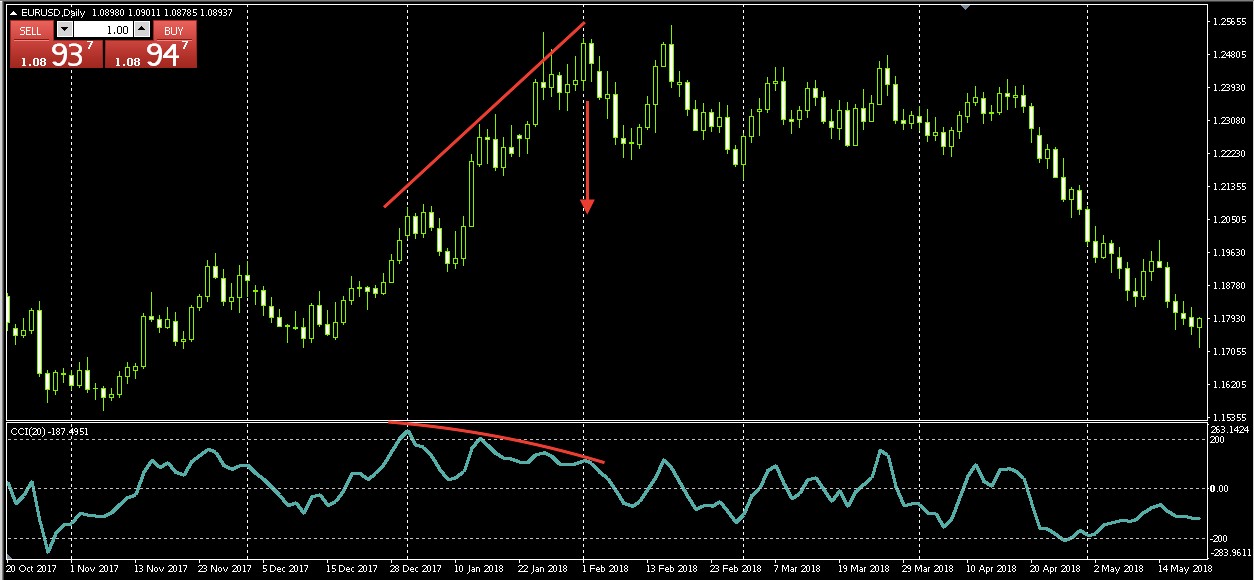
Such signals are formed quite rarely. Novice traders are not recommended to use divergence when working with real funds. It is better to give preference to the classical signals of any oscillator:
- The intersection of the -200 level line from the bottom up - opening a Buy order.
- If the CCI line crosses level 200 from top to bottom, this indicates a possible change in the uptrend to the downtrend, that is, you need to consider only the opening of Sell orders.
Having familiarized yourself with the functionality of the CCI indicator, you can proceed to consider the trading strategy.
Effective Forex CCI Oscillator
To make trading decisions, only one type of CCI signal will be used - a line crossing the overbought / oversold levels. The use of additional indicators for the false signal filter is not necessary, but it is perfectly acceptable to consider a simple moving average with a period of 20. In this case, the confirmation of the correctness of the opening of the Sell order will be the formation of price elements below the trend indicator. If the chart is built above the moving one, this will be a confirmation for opening a Buy transaction.
General characteristics of the strategy:
- The optimal currency pairs for trading on the CCI indicator are EUR / USD, GBP / USD, AUD / USD.
- H1 or H4 timeframes;
- When trading within a day, placing a Stop Loss order is mandatory (+ 10-12 points from the last local level);
- Take Profit can be fixed and make up to 30% of the average daily volatility of the asset when working with the H1 period, and up to 100% when analyzing H4 charts;
- A signal for closing a transaction with fixing the financial result is the formation of the opposite signal in the oscillator window;
- The risk on the transaction should not exceed 5% of the deposit;
- The use of the Martingale method for optimizing losses should be considered only by experienced traders;
- Trading session can be any.
During testing the CCI strategy, it was possible to identify that the number of successful transactions is about 80%, and the profit potential of each order with respect to possible losses varies in the range from 3:1 to 4:1.
To open a Buy order, you need to wait for the CCI line to cross the level 200 from the bottom up. Consideration of sales orders should be at the intersection of the oscillator curve of the level 200 from top to bottom. When transferring the indicator to the price chart, it is extremely important to indicate previously considered parameters.
To understand the principle of trading, it is recommended to pay attention to several examples:
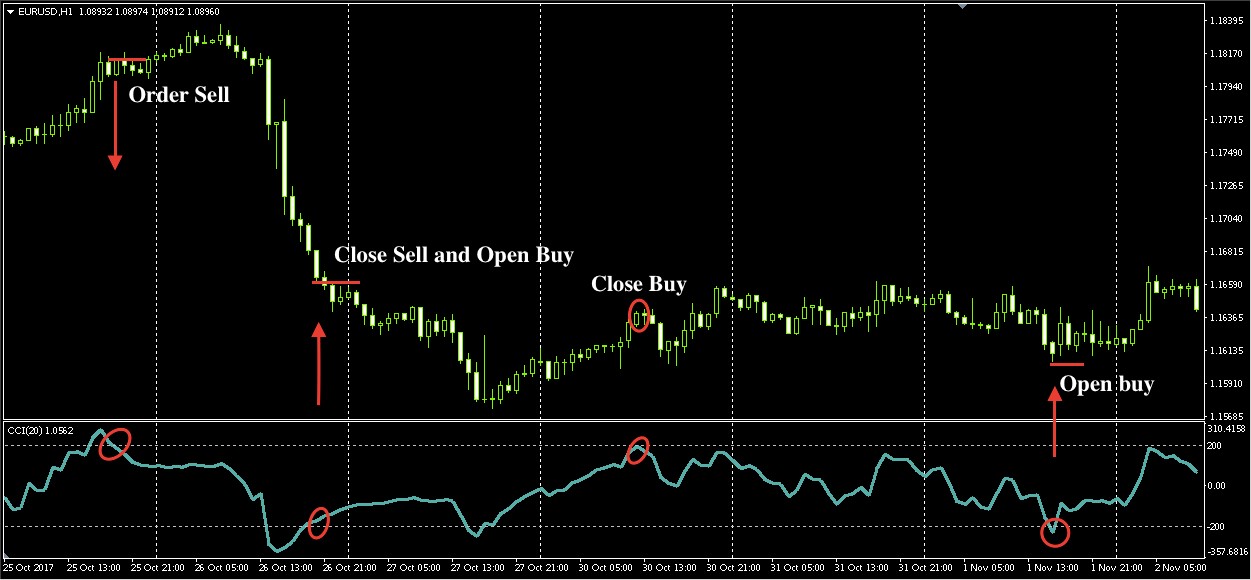
The image shows a EUR / USD pair chart with H1 timeframe. This timeframe is optimal for intraday CCI trading. At lower time periods, the accuracy of the indicator signals is noticeably lower.
In the chart, the points of opening orders are marked with a red marker. Please note that out of 3 signals, only one transaction was closed with a slight loss, which confirms the statistics presented earlier.
Attention! The CCI oscillator, unlike other analytical tools of this type, has a unique feature - when working with H4 charts, the exit of the CCI line from overbought / oversold zones is a guaranteed trading signal. What does it mean? This means that even if the chart does not change direction after the order is opened, if the CCI curve touches the opposite level, the value of the asset will be significantly higher / lower (depending on the direction of the order) the price at the time of opening the transaction.
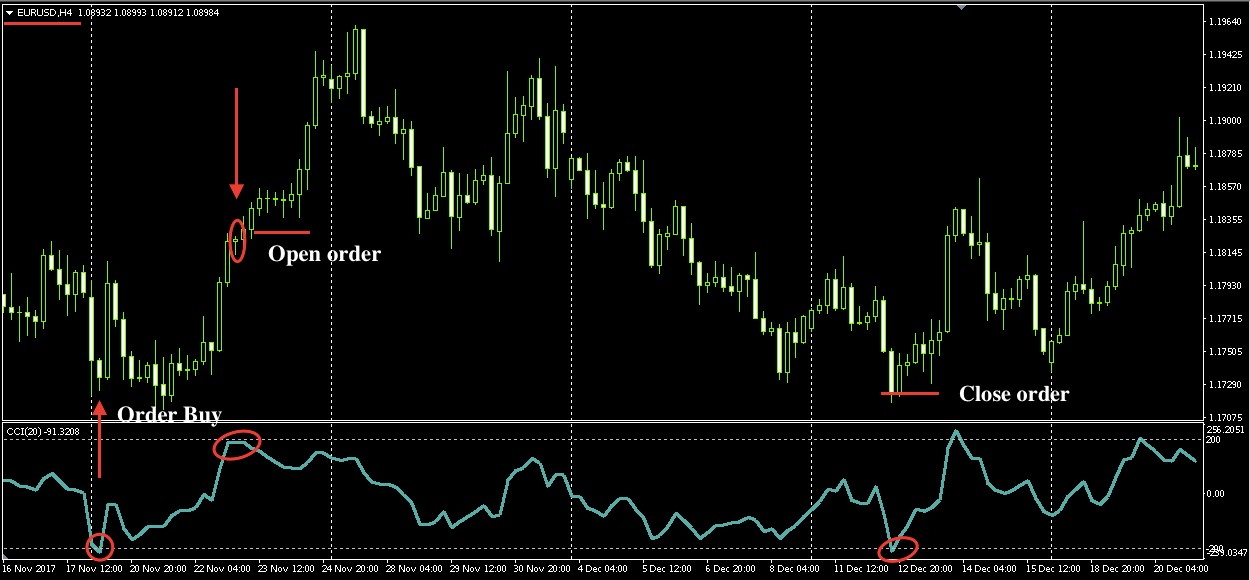
Novice traders, without real trading experience, are advised to consider this particular timeframe. The first Buy order fully met expectations and closed with profit taking. Now you should carefully consider the second trading signal, which clearly turned out to be false.
After the transaction was opened, the chart continued to move in an upward direction, but note that the CCI line indicates divergence (the chart is moving up and the curve is moving down), which indicates a fast reversal of the global trend. Similar signals on H4 timeframe and above cannot be ignored. It is also important to note that at the moment the oscillator touched the oversold level, the current value of the asset was significantly lower than the price when opening a transaction. As a result, the order closed with a significant profit taking.
Attention! For successful trading according to the second method, placing safety orders is not required. They need to be replaced with such techniques as locking and averaging. Successful trading on this strategy requires the trader to have real trading experience and a solid knowledge of theory. Therefore, it is strongly recommended for beginners while trading real funds to limit themselves to short-term orders, analyzing H1 charts.
Conclusion
The functionality of the CCI oscillator allows you to evaluate the tool as a complete trading strategy in the foreign exchange market. To do this, just specify the correct settings when transferring the indicator to the chart. For the successful application of the considered strategy, it is important to comply with the rules of money management (risk no more than 5% per transaction), as well as respond to oscillator signals in a timely manner.